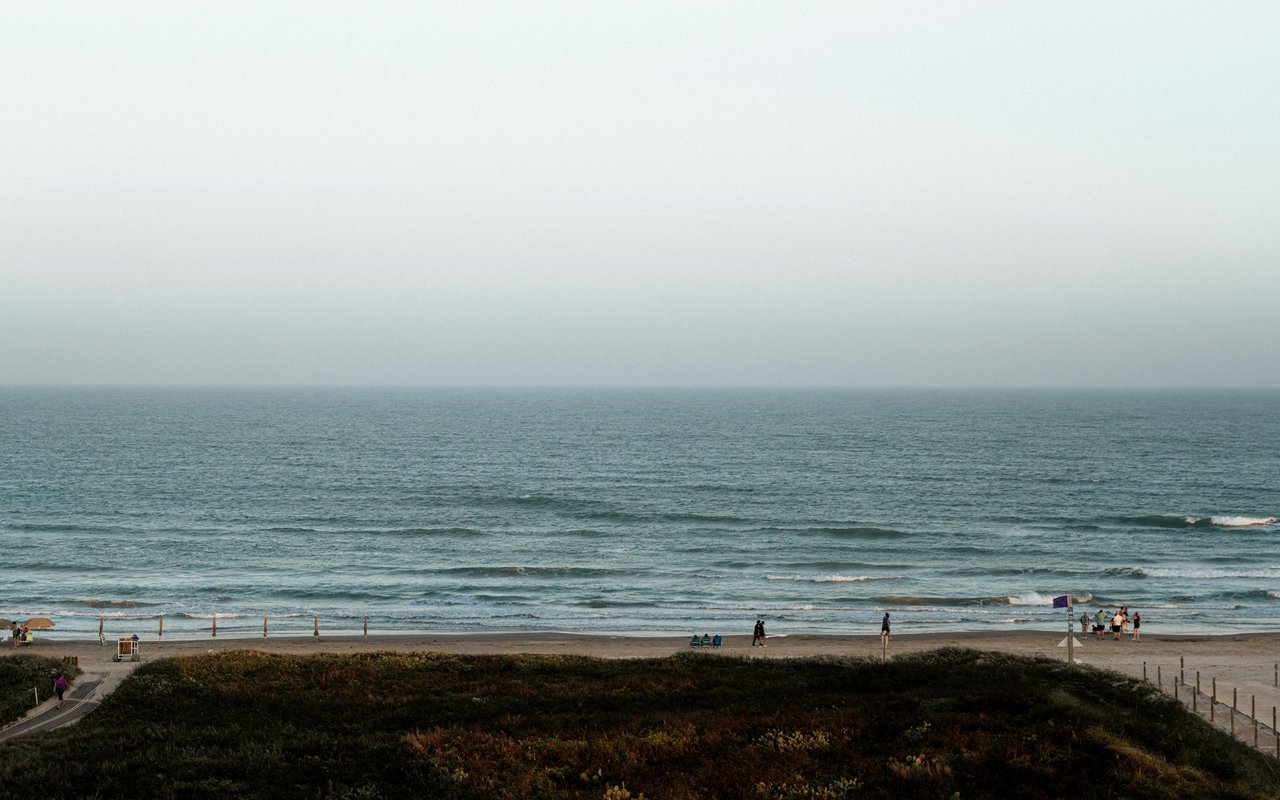
Living on an island within either walking distance or a very short drive to the beach or boat canals is for some a dream come true. Access to the water is king and for many watching sunrise, sunset, moonrise and moonset gives their lives the best perspective and their days that little reason for being. Living on Padre Island involves some drives over the JFK bridge to get to and from the Corpus Christi mainland.
Amenities on the island have grown and include some of the area’s best restaurants, amenities and even a new grocery store. The cost of living is higher than the Corpus Christi average and crime rates are significantly lower. There are private schools on the island for pre-k, elementary and middle school or there is the excellent Flour Bluff Independent School District located over the bridge for all levels.
With a small population of just over 4K, the island offers a feeling of ‘getting away’ without having to go too far from life’s necessities, especially for families. The locals refer to the island as pet friendly, quiet, holiday/ vacation spirit, a car is needed, yards are well-kept, and people feel safe to walk alone at night.
30,201 people live in North Padre Island, where the median age is 43.2 and the average individual income is $46,960. Data provided by the U.S. Census Bureau.
Total Population
Median Age
Population Density Population Density This is the number of people per square mile in a neighborhood.
Average individual Income
There's plenty to do around North Padre Island, including shopping, dining, nightlife, parks, and more. Data provided by Walk Score and Yelp.
Explore popular things to do in the area, including 361 Kite.
North Padre Island has 12,424 households, with an average household size of 2.42. Data provided by the U.S. Census Bureau. Here’s what the people living in North Padre Island do for work — and how long it takes them to get there. Data provided by the U.S. Census Bureau. 30,201 people call North Padre Island home. The population density is 411.77 and the largest age group is Data provided by the U.S. Census Bureau.
Total Population
Population Density Population Density This is the number of people per square mile in a neighborhood.
Median Age
Men vs Women
Population by Age Group
0-9 Years
10-17 Years
18-24 Years
25-64 Years
65-74 Years
75+ Years
Education Level
Total Households
Average Household Size
Average individual Income
Households with Children
With Children:
Without Children:
Marital Status
Blue vs White Collar Workers
Blue Collar:
White Collar:
Bringing together a team with the passion, dedication, and resources to help our clients reach their buying and selling goals. With you every step of the way.


